How do I view my event analytics?
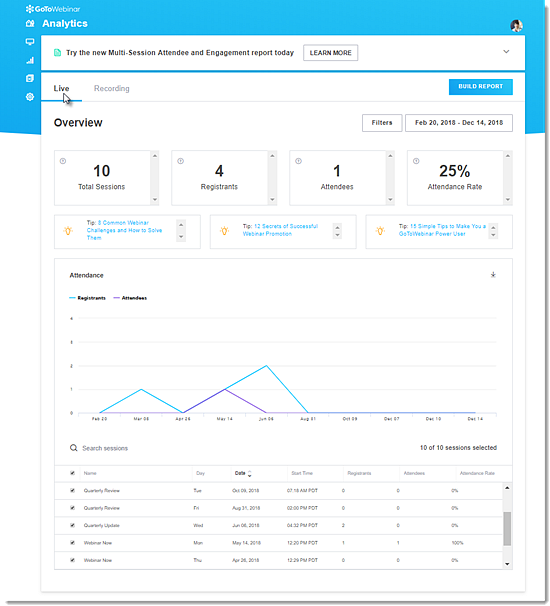
Webinar event analytics allow you to view high-level data of your webinar history in easy-to-read charts and stats! You can see analytics for all your live events or recordings, or get details on a specific session. You can also built reports to get detailed analytics of a specific session from this page.
- Sign in to your account at https://dashboard.gotowebinar.com.
- Access your analytics in any of the following ways from the Dashboard:
- Click the Bar Graph icon in the left toolbar.
- Scroll down to the Analytics section and click View Details.
- The Analytics page displays a high-level overview of your past live events on the Live tab and all recordings (including videos uploaded to your GoTo Stage channel) on the Recording tab. You can filter and sort webinars to find details of a specific session.
- Add Filter – Filter webinars by the number of registrants and attendees.
- Change date range – Customize your list of webinars by changing the date range.
- Build Report – Generate reports for detailed analytics of a session. There are multiple types of reports you can generate.
- Search – Search for a specific webinar by typing in the webinar name.
- Print or download chart – Download the chart as a .PNG, Excel, or CSV file for external use.

